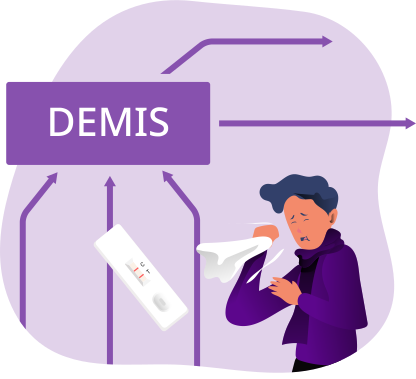
A patient presents to the hospital with unclear upper abdominal pain. Laboratory testing shows elevated cholestasis parameters, mildly elevated bilirubin, and only moderately elevated transaminases. Viewed in isolation, this suggests a hepatobiliary cause — such as early biliary obstruction, an inflammatory hepatobiliary condition, or drug-induced liver injury.
What is not visible in the laboratory order: for several days, the patient has been feeling more easily exhausted than usual; in the evenings, her ankles have been slightly swollen, and she has recently been taking her diuretic medication irregularly. In the context of acute upper abdominal pain, this initially seems secondary. However, the ultrasound shows no evidence of dilated bile ducts.
Only when the findings are considered together does a different picture emerge: the abnormal liver values are not primarily an expression of liver or biliary disease. Instead, together with the supposedly incidental ultrasound findings — congested hepatic veins and a dilated inferior vena cava — they fit with congestive hepatopathy due to right-sided heart strain.
Each individual finding was correct in itself. And yet the decisive diagnostic direction only emerges when these perspectives are brought together. This is precisely where the concept of integrated diagnostics begins.
The problem: correct findings, incomplete picture
Diagnostic disciplines often cannot realize their full potential because they lack the relevant perspectives from other areas. The laboratory physician interprets values without the full clinical context, the radiologist reports images without current laboratory constellations, and the clinician makes decisions based on the information that actually reaches them. It is not only information that is lost, but above all the interpretations and perspectives that each discipline could contribute.
Diagnostics therefore suffer not primarily from a lack of data, but from fragmentation: relevant information is distributed across systems, coded inconsistently, and rarely available in a form that makes it usable for shared assessment.
A good starting point: integration in the laboratory
A natural starting point for integrated diagnostics is the laboratory — not least because this is where different diagnostic disciplines are closely connected and can be meaningfully brought together: clinical chemistry, microbiology, pathology, and cytology. Even within these areas, significant added value arises when findings are not viewed side by side, but in context. The laboratory is far more than a place where measured values are produced: it ensures analytical quality, checks plausibility, takes methodology and preanalytics into account, and provides interpretive comments.
For this contribution to have an impact beyond the boundaries of the laboratory, a shared data foundation is needed. Standardization and harmonization using established standards such as LOINC, SNOMED CT, and FHIR are prerequisites for a laboratory value to be not only measured, but also machine-comparable, contextualizable, and linkable with other sources. In this way, an isolated result becomes an interoperable building block. Laboratory integration is therefore not an end in itself, but the foundation on which all further connections are built.
Bringing all areas together: synthesis as a diagnostic principle
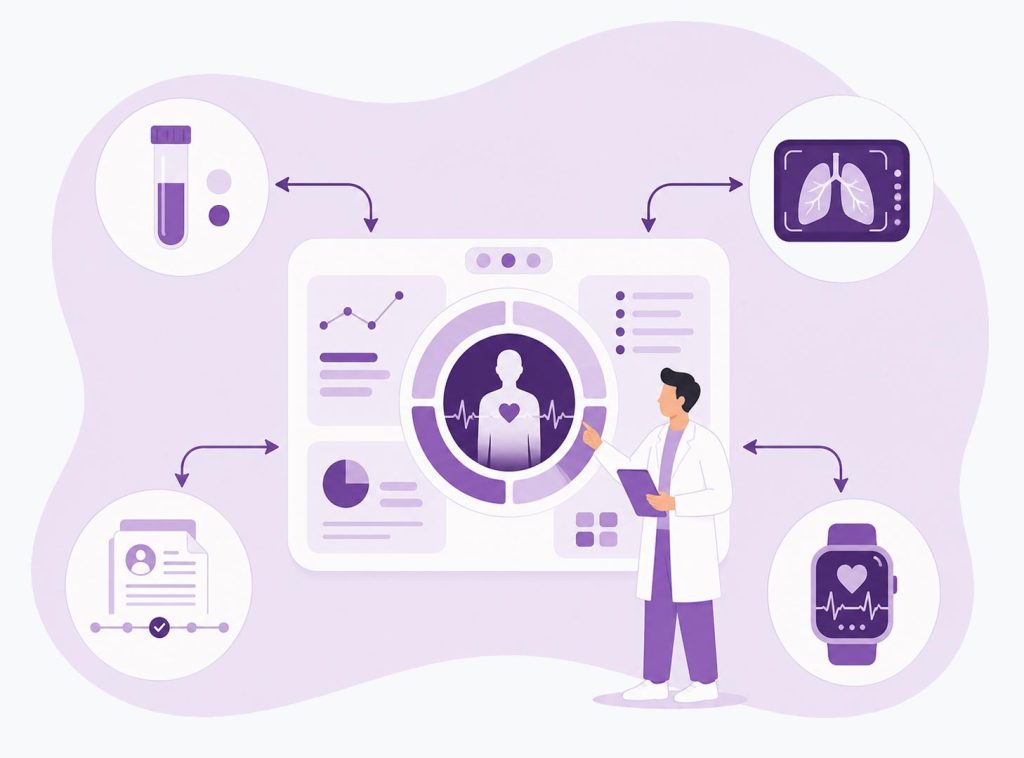
From this foundation, the perspective can be broadened beyond the laboratory — to imaging, functional diagnostics, and the clinical course. Each of these sources generates valuable findings in its own right; however, their diagnostic value increases significantly when they are brought together in a shared view.
The key is not to place all available data side by side without filtering. What matters is presentation that is appropriate to the situation and the target group: the radiologist receiving a request for cardiac MRI in suspected hypertrophic cardiomyopathy needs different contextual information than the clinician at the bedside or the medical technical assistant in the laboratory. An integrated platform checks all available information in the background and provides an appropriate summary for the respective diagnostic task — with the option to drill down into specific points, consult guidelines, and support decision-making.
The effect becomes clear in the details: a radiologically described “diffuse wall thickening” can, through access to additional laboratory and clinical findings, become a well-founded suspicion of amyloidosis. The finding does not change because the image is different — but because it is read in the right context.
Previous findings: the temporal dimension of diagnostics
A complete perspective requires not only breadth across disciplines, but also depth over time. Previous findings — earlier laboratory values, older imaging, documented diagnoses, longitudinal parameters — are often the key to correctly interpreting a current finding.
In practice, this information is often available only in forms that are difficult to use: as scans, PDFs, handwritten notes, or in systems that do not communicate with one another. Modern approaches to document processing, such as OCR and language-model-supported extraction, can also convert such unstructured previous findings into structured, usable data. Cumulative displays then enable longitudinal assessment — for example, the development of an inflammatory marker over several days or the course of microbiological findings during a hospital stay.
An example from the sleep laboratory illustrates the value of this temporal depth: polysomnography for suspected sleep apnea shows a pronounced obstructive component — initially a clear case for CPAP therapy. However, when a three-year-old CT finding showing mild hydrocephalus, a documented neurological preliminary assessment, and currently increasing headaches with visual disturbances and gait instability are taken into account, the mildly expressed central component becomes more relevant. It does not prove a neurological cause, but in the context of progressive neurological symptoms it may justify reassessing the old hydrocephalus diagnosis neurologically or neuroradiologically. Without the previous findings, this diagnostic trail would remain invisible.
Patient-generated data: fitness trackers and wearables
Diagnostically relevant information is no longer generated only in laboratories and hospitals. Fitness trackers, smartwatches, and other wearables produce continuous longitudinal data on heart rate, heart rhythm, physical activity, sleep, and oxygen saturation — over weeks and months, in people’s everyday lives and therefore outside the snapshot of a single examination.
On their own, these data are not a diagnosis. Placed in the right context, however, they can provide valuable preliminary information: a rhythm pattern documented over several weeks can sharpen a cardiological question, while a changed activity or sleep profile can help objectify symptom descriptions. The methodological standard remains the same as for any other data point: origin, measurement quality, and informative value must be transparently assessed before such signals are incorporated into diagnostic evaluation. This critical interpretation — not the mere collection of data — is the real contribution of an integrated perspective.
Mutual interaction in stepwise diagnostics
Perhaps the most important idea behind integrated diagnostics is that diagnostic steps do not simply follow one another in isolation, but influence one another. In classical stepwise diagnostics, one finding leads to the next step. Integrated diagnostics adds a cross-linking logic to this linear approach: a result from one area can change the interpretation of a finding in a completely different area — often retrospectively.
A case from radiology illustrates this particularly clearly. A cardiac MRI is performed in a patient with chest pressure, palpitations, and reduced performance after a flu-like infection. The MRI shows a non-ischemic contrast enhancement pattern and signs of myocardial edema. In the context at the time, the finding fits well with myocarditis: the symptoms are acute, the infectious history is plausible, and troponin is mildly elevated.
At first, the diagnostic direction seems clear. A few weeks later, however, new information becomes available: the patient develops recurrent arrhythmias, the ECG shows a conduction abnormality, and a chest CT performed for another reason describes enlarged mediastinal lymph nodes. In this new context, the earlier MRI finding becomes relevant again. What initially appeared to be post-infectious myocarditis can now also be interpreted as cardiac involvement in a systemic inflammatory disease — for example, sarcoidosis.
The original MRI finding was not wrong. It was interpreted plausibly in the context available at the time. Only the later additional information changes its diagnostic significance: a seemingly closed finding becomes an important piece of the puzzle for the next diagnostic step.
This interaction works in both directions. Proactive, rule-based prompts can intervene as early as the order entry stage: for example, when an extended liver panel is ordered without a recognizable clinical question; when an examination using iodinated contrast medium is planned in a patient with a relevant thyroid risk but without an available thyroid assessment; or when spirometry is ordered and a diaphragmatic hernia is documented. This creates a feedback loop in which each step is aware of the others — and diagnostics as a whole gains coherence.
Better outcomes for patients and hospitals
The value of this synthesis can be seen in the results. For patients, integrated diagnostics primarily means more precise and earlier diagnoses — and thus access to the right therapy at the right time. Relevant constellations can be recognized earlier; unnecessary or duplicate examinations, with their associated burdens and delays, can be avoided.
For hospitals and diagnostic departments, medical benefit is combined with economic and process-related value. A continuous data flow reduces interface breaks and duplicate documentation. Avoidable diagnostics relieve pressure on resources and staff, while targeted requests increase the informative value of examinations. Real-time transparency regarding medical, process-related, and economic key figures makes deviations visible at an early stage — from equipment utilization and open orders to analytical workflows — and enables role-specific presentation for medical technical assistants, physicians, management, and IT.
For this benefit to remain reliable, the underlying decision support must be transparent and explainable. An explainable, hybrid approach — one that combines validated research knowledge, guidelines, and rule-based logic with prediction models and language models, rather than relying on a black box — is the prerequisite for integrated diagnostics to earn trust in everyday clinical practice. It is not the amount of data that matters, but its reliable and transparent interpretation.
Conclusion
Integrated diagnostics does not reinvent diagnostics. It connects what is already being measured, reported, and documented — across disciplines, over time, and beyond the boundaries of laboratory and hospital. The decisive step is not more data, but the meaningful linking of data: starting from a structured laboratory foundation, expanded by previous findings and patient-generated data, and guided by the principle that every diagnostic step is aware of the others.
Where this succeeds, diagnostic disciplines together unlock a potential that remains inaccessible to each of them alone — to the benefit of patients, treating physicians, and the institutions responsible for diagnostics.